SUMMARY
During fiscal year 2017, the NCI awarded a total of 1,139 competing Research Project Grants (RPGs), which represented an overall success rate[1] of 12% and 12% for R01s. The overall R01 success rate decreased compared with 2016 because there was a large increase in the number of R01 grant applications. Fiscal year 2017 begins the inclusion of Cancer Moonshot funding. Unsolicited R01 and R21 grants represent 67% of the total number of awards. NCI funded nearly all R01 applications with scores up to and including the 10th percentile[2] and R21 applications with scores up to and including the 7th percentile. Special consideration was given to support funding for Early Stage R01 Investigators[3]; as a result, all applications in this group with scores up to and including the 12th percentile were funded. The R03 and R15 applications with impact scores[4] up to and including a score of 25 were funded. NCI funded applications with scores beyond the payline after review and approval by NCI's Divisions and Scientific Program Leaders during special meetings with the NCI Director. The graphs that appear below summarize the overall funding patterns for R01s and R21s across various categories of investigators.NCI introduced the R35 Outstanding Investigator Award (OIA) in fiscal year 2015, to support investigators with outstanding records of productivity in cancer research by providing extended funding stability for projects of unusual potential. OIA recipients are required to relinquish their current R01 awards in accepting the OIA and to commit at least 50% effort to the OIA research. Consequently, the number of OIAs is likely to affect the overall number of R01s over time.
Funding Patterns for R01 Applications
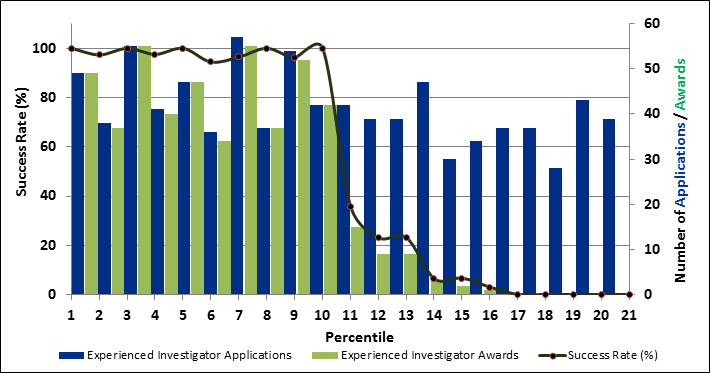
The graph in Figure 1
summarizes the number of percentiled R01 applications received and grants funded at each
percentile, among all investigators. As is evident, beyond the 10th percentile, the number of grants
funded decreased in proportion to the percentile ranking. Nevertheless, 13.5% of these awards had rankings
beyond the 10th percentile.
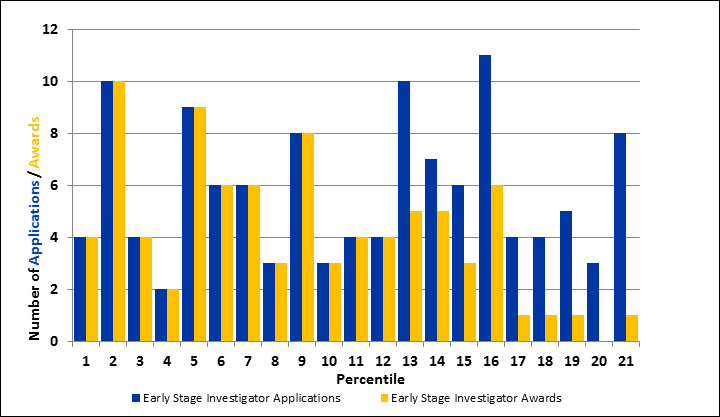
Similar displays are shown below for experienced investigators (applicants who have
received a prior R01 award and were applying for a new grant or a competitive renewal; Figure 2); new
investigators[3] (Figure
3);
and early stage investigators[3] (Figure 4).
Similar patterns are observed in all cases. Success rates have not been plotted for new and early stage
investigators because of the small numbers of applications at each percentile score. For Success Rate
comparisons, refer to Tables 1 and 2
below.
Funding Patterns for other years are posted at: https://gsspubssl.nci.nih.gov/blog/articles.
[1]
The success rate is the percentage of applications received that are funded. It is calculated by
dividing the number of funded grants by the number of applications received. When an amended application is
considered in the same fiscal year as the original, only the application with the better score is counted in
the number of applications received.
[2]
A percentile is a score that ranks competing applications against others in the same study section in
the past year. It is intended to allow a comparison of impact scores[4]
of applications across all study sections.
[3]
The New Investigator is one who has not previously competed successfully for an R01 or other
substantial NIH independent research award. An Early Stage Investigator is a New Investigator who is
within 10 years of completing his/her terminal research degree or medical residency (or the
equivalent). A more detailed definition can be found at: https://grants.nih.gov/policy/new_investigators/index.htm#definition.
[4]
The impact score is given by each individual scientific reviewer's assessment of the scored criteria
plus additional criteria regarding the protection and inclusion of human subjects; vertebrate animal care
and welfare; biohazards, and criteria specific to the funding opportunity and is based on the overall impact
that the project is likely to have on the research field(s) involved.
NCI FY2017: "Percentiled" R01 Applications, Awards and Success Rates
Figure 1: All Investigators: Experienced, New and Early Stage
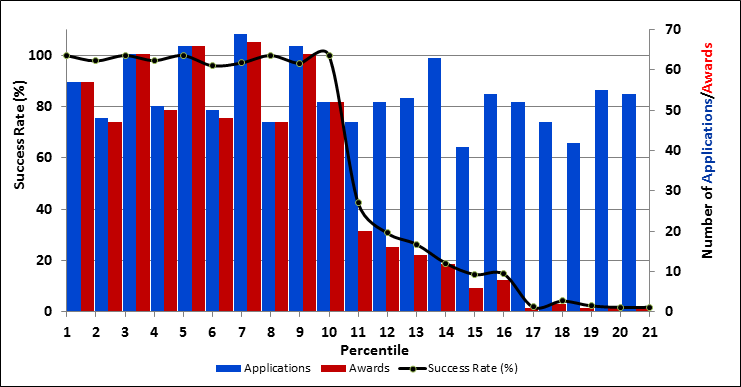
NCI FY2017 Competing R01 Applications and Awards
Figure 3: New Investigators (Includes Early Stage Investigators)
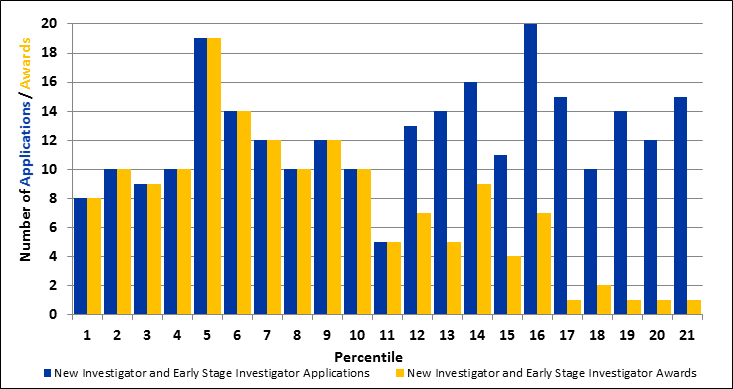
Figures 1-4:
Excludes applications that did not receive a percentile ranking. When an amended application is considered in
the same fiscal year as the original, only the one with the better ranking is counted.
Funding Patterns for R21 Applications
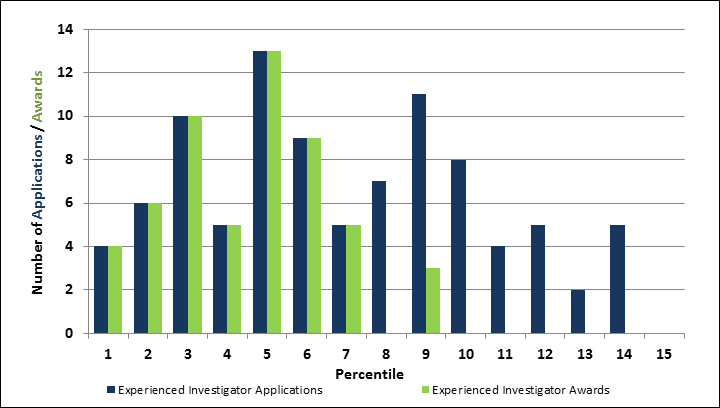
The funding patterns for R21 grant applications differ from those of R01 applications. The patterns are
explained by the fact that NCI receives a disproportionate number of applications relative to the number of R21
grants that can be funded (see Table 1). Of the Competing R21s
funded, 15% had rankings beyond the
7th
percentile. The number of R21 applications decreased in FY 2017, as NCI no longer has an R21 omnibus FOA and
does not accept unsolicited R21s.
In contrast to R01 funding patterns, success rates for R21 funding of applications
from new investigators (applicants who have never received an R01; Figure
7) are notably lower at 5% than for
experienced investigators with 11% (applicants who have received a prior R01 award; Figure 6) (Table 1).
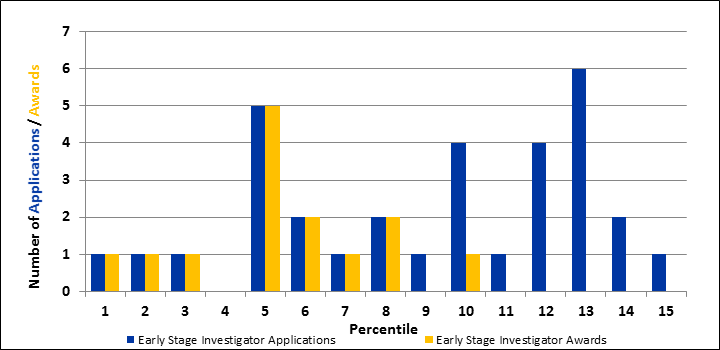
Furthermore, whereas the R01 success rate for new investigators is 11%, it is 5% for R21s. This disparity
results from the fact that R01 applications, but not R21 applications, from new investigators and particularly
the subset of early stage investigators are given preferential consideration. Early stage investigators are new
investigators within 10 years of receiving their highest degree or completing their clinical training who have
not had an R01 award; Figure 8.
NCI FY2017: R21 Applications, Awards and Success Rates
Figure 5: All Investigators: Experienced, New and Early Stage
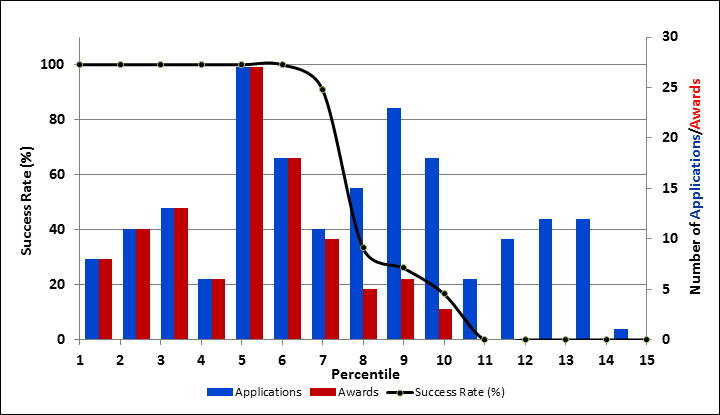
NCI FY2017 Competing R21 Applications and Awards
Figure 7: New Investigators (Includes Early Stage Investigators)

NCI applied the same R01 criteria to identify new and early stage investigators. For Success Rate
comparisons, refer to Tables 1 and 2
below.
Figures 5-8:
Excludes applications that did not receive a percentile ranking. When an amended application is considered
in the same fiscal year as the original, only the one with the better ranking is counted.
Table 1: Fiscal Year 2017: Success Rates (unsolicited R01s and R21s)
| Total Applications | Number With Percentiles 1-21 |
Number With Percentiles 1-10 |
Funded | Success Rate | |
|---|---|---|---|---|---|
| R01 - All Investigators | 5,263 | 1,130 | 570 | 650 | 12% |
| Experienced Investigators - Total | 3,765 | 871 | 456 | 490 | 13% |
| Type 1 | 3,388 | 728 | 370 | 400 | 12% |
| Type 2 | 371 | 141 | 85 | 89 | 24% |
| Type 3 Board | 6 | 2 | 1 | 1 | 17% |
| New Investigators - Total1 | 1,498 | 259 | 114 | 160 | 11% |
| Early Stage New Investigators2 | 589 | 121 | 55 | 87 | 15% |
| R21 - All Investigators | 1,513 | 294 | 150 | 109 | 7% |
| Experienced Investigators | 532 | 142 | 78 | 56 | 11% |
| New Investigators | 981 | 152 | 72 | 53 | 5% |
| Early Stage New Investigators2 | 247 | 45 | 18 | 15 | 6% |
Total new and competing renewal applications include those that received either a
percentile, an impact score, as well as those that were not discussed (triaged) or were not recommended for
funding.
Funded R01s include competing revisions.
1 Includes Early Stage Investigators
2 Included in New Investigators
The NIH does not report the R21 grants in
terms of experienced and new investigators; NCI applied R01 criteria to identify those parameters.
Table 2: All Competing Research Project Grants
| FY 2014 | FY 2015 | FY 2016 | FY 2017 | |||||||||
|---|---|---|---|---|---|---|---|---|---|---|---|---|
| Requested | Funded | Success Rate | Requested | Funded | Success Rate | Requested | Funded | Success Rate | Requested | Funded | Success Rate | |
| R01 - Unsolicited1 | 3,849 | 578 | 15% | 4,550 | 623 | 14% | 4,785 | 650 | 14% | 5,263 | 650 | 12% |
| R01 RFAs | 391 | 51 | 13% | 102 | 12 | 12% | 240 | 45 | 19% | 309 | 44 | 14% |
| Total R01 | 4,240 | 629 | 15% | 4,652 | 635 | 14% | 5,025 | 695 | 14% | 5,572 | 694 | 12% |
| R21 - Unsolicited | 2,539 | 302 | 12% | 2,864 | 325 | 11% | 3,100 | 260 | 8% | 1,513 | 109 | 7% |
| R21 RFAs | 397 | 53 | 13% | 250 | 38 | 15% | 283 | 35 | 12% | 388 | 44 | 11% |
| Total R21 | 2,936 | 355 | 12% | 3,114 | 363 | 12% | 3,383 | 295 | 9% | 1,901 | 153 | 8% |
| R35 | - | - | 224 | 43 | 19% | 175 | 35 | 20% | 141 | 29 | 21% | |
| R03 | 627 | 93 | 15% | 582 | 67 | 12% | 484 | 48 | 10% | 714 | 90 | 13% |
| Other RFAs2 | 226 | 35 | 15% | 297 | 34 | 11% | 285 | 62 | 22% | 443 | 57 | 13% |
| Other RPGs3 | 510 | 95 | 19% | 656 | 94 | 14% | 889 | 95 | 11% | 933 | 116 | 12% |
| Total Competing RPGs: | 8,539 | 1,207 | 14% | 9,525 | 1,236 | 13% | 10,241 | 1,230 | 12% | 9,704 | 1,139 | 12% |
The number of R21 applications decrease in FY 2017, as NCI no longer has an
R21 omnibus FOA and does not accept unsolicited R21s.
1 Funded R01s include competing revisions.
2 Other RFAs include UM1, R33, U01, UH2, and UG3.
3 Other RPGs include DP2, P01, R15, R37, R50, R56, U01, U19, UH2, UM1, and UG3.
Funding Patterns for other years are posted at: https://gsspubssl.nci.nih.gov/blog/articles.


